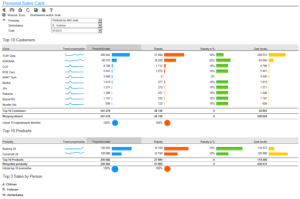
Reporting turns data into information that helps drive analysis, budgeting and planning processes or supports decision-making. One of the key aspects of reporting is the visualisation of information, both in terms of matching it to appropriate recipients and its availability.
The solutions we offer consist of reports based on all data contained in the central database or other external sources, presenting the results of individual departments, as well as financial data by products or any other measure. They help to reach the required information, even if its extraction requires processing a large amount of data.
The solutions support the work of managers through the use of commonly used measures and indicators, such as:
- revenues,
- costs,
- productivity,
- profitability,
- return on investment.
The system helps to analyse the organisation’s activity through non-financial measures, such as: customer satisfaction level, effectiveness of promotional campaigns, quality or employment retention. One of the functions is the possibility of generating ad hoc analyses. The system allows measures to be presented as trends or deviations from trends, which helps to analyse operations from different perspectives and supports management methods based on the Balanced Scorecard (BSC).
More about reporting, including sample demos, screenshots in the category – Reporting, analysis and data visualisation – or on the respective product pages. For some of them, it is also possible to test the software for free.
We have knowledge, practice and references in this area, allowing us to select and implement software from leading vendors such as: Infor Birst, Infor, Microsoft, Oracle, IBM .


